Saving Our soils project
Monitoring water quality in the Werribee River
Background
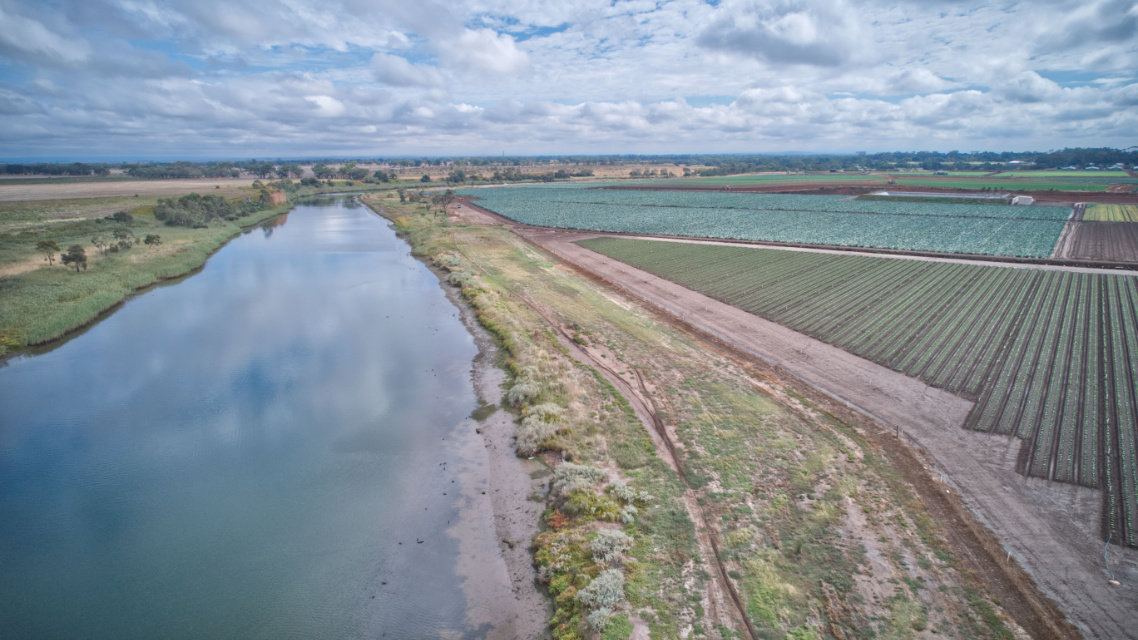
The Saving Our Soils program, an initiative through the Werribee River Association aims to increase the efficiency of the market gardens, while improving river and waterway health. Soil can run off farms due to excessive irrigation and rain, taking with it, sediment, pesticides and nutrients. Not only is this inefficient for farmers who have to keep replacing what is gone, but the runoff into the river effects the health of our waterways. The Werribee River Association engaged Bio2lab to install two real-time water quality monitoring stations along Werribee River at strategic locations as a way to assess the impact of this runoff continuously over the next two years. As part of the broader project, revegetation of areas prone to erosion will attempt to slow the movement of run-off and reduce sediment and associated pollutants from entering the Werribee River. The sensors will allow the Association to assess the success of the revegetation projects over the longer term by monitoring turbidity (an indicator of of soil run-off).
Project update
Real-time water quality sensors were installed in the Werribee River, both upstream and downstream of the areas being revegetated along the river’s edge. Monitoring commenced on September 2nd 2023, which was delayed due to on-going local grower engagement and changes in the design of the monitoring program to better suit the on-ground revegetation work.
During the first six months of monitoring, a total of 26,436 data points were collected at each location, with the data evenly distributed between these two locations. Water quality parameters included turbidity, electrical conductivity and temperature.
The interactive app below provides and overview of the data collected over the first six months. Hovering over the data will allow you to interact with the plots, displaying water quality values. By selecting specific time periods you can interogate temporal data in more detail, while drawing a box over the data will allow you to select specific time periods. In the top right hand corner of each plot, there is a menu that will allow you to navigate the data in more detail.
Water quality monitoring
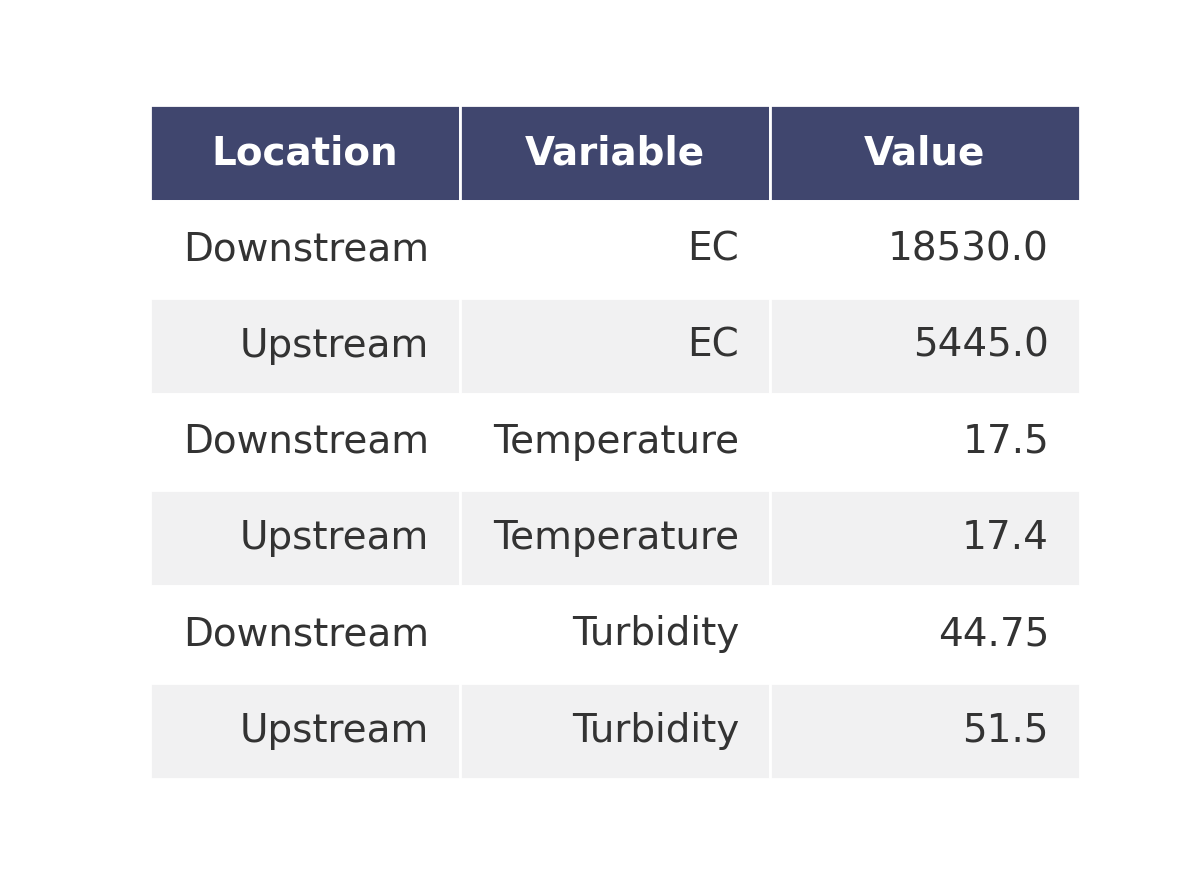
Water quality varied between the upstream and downstream site. Electrical conducivity (EC) was higher at the upstream site compared to the downstream site, while turbidity was slightly lower at the upstream site compared to the downstream site and water temperature was comparable across the two sites (figure 1). The minimum and maximum values were also comparable across the two sites (figure 2), however the very high maximum water temperatures recorded suggest that the sensors spent some time out of the water due to very low water levels.
The first six months of monitoring has allowed the werribee River Association to better understand the maintenance requirements of the monitoring stations. For instance, it become evident that a regular cleaning regime was required to keep the sensors performing as expected. This was because biofilm ((often microorganisms in the water that adhere to surfaces such as sensors), can often interfere with the function of sensors, especially turbidity, which uses light as an indicator of turbidity levels. And while the sensors installed in this project have been designed to cope with some levels of biofilm build up, regular cleaning of the sensors will keep the readings more accurate and extend the life of the sensors themselves.
Summary
It is anticipated that as more water quality data is collected from the real-time sensors, a clearer picture of soil erosion from market gardens in Werribee South will emerge. As plantings along the river’s edge take hold, we should expect to see the differences in turbidity levels between the two sites reduce, as vegetation slows the movement of soils off the market gardens and cleans the water through natural infiltration processes.
Figure 1
The median values for each of the water quality parameters monitored over the six month period. Units for each variable include (turbidity - NTU, EC - electrical conductivity and temperature - °C)

Figure 2
The maximum and minimum values for each of the water quality parameters monitored over the six months. Units for each variable include (turbidity - NTU, EC - electrical conductivity and temperature - °C)


